📊 September 2025 Market Snapshot
Salt Lake City remains a seller’s market, but signs of balance are emerging. Inventory has ticked up and days on market have edged higher year over year—creating windows of opportunity for well-prepared buyers—while prices continue to hold firm.
Visual Aid Ideas: Autumn-themed bar charts for price & DOM, a simple “months of inventory” gauge, and a city vs. county comparison card.
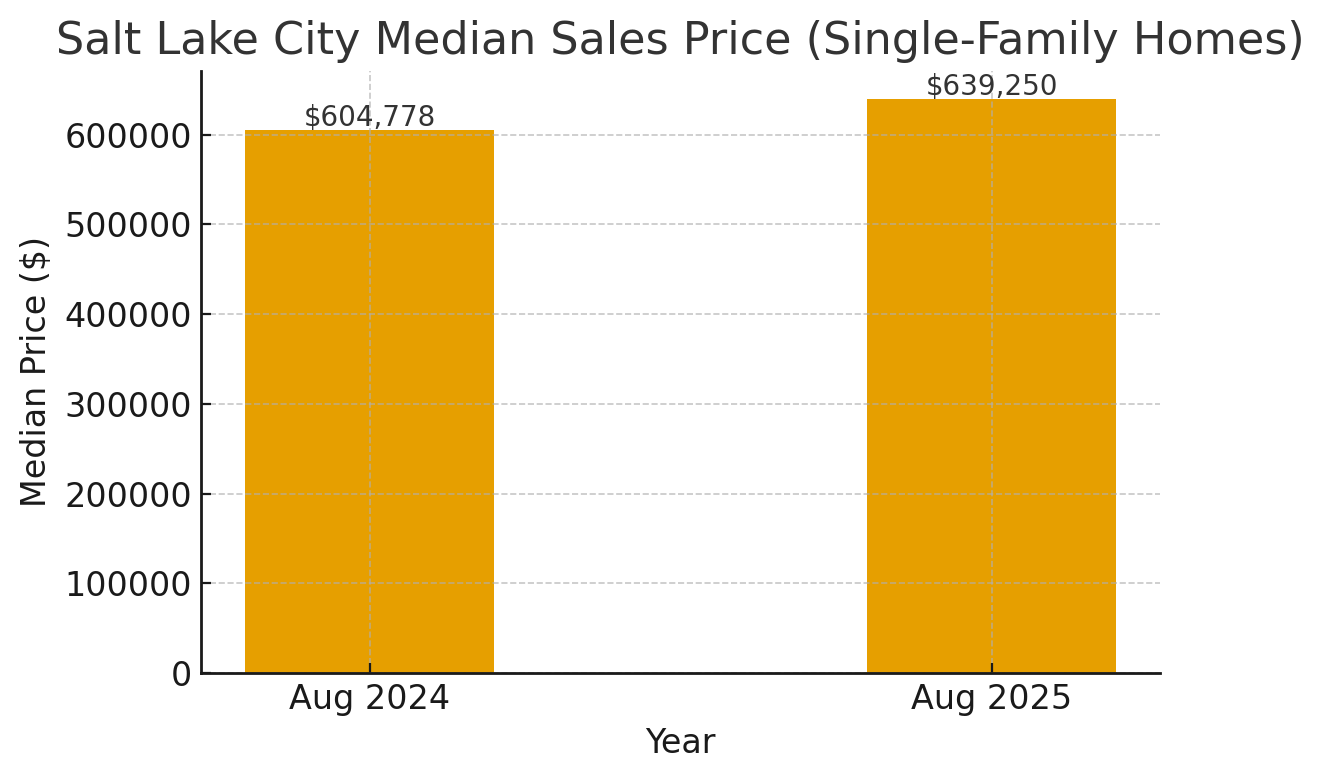
🏡 Home Prices: Still Rising Year over Year
-
SLC Median Sales Price (SFH, Aug 2025): $639,250
-
YoY Change: +5.7% vs. Aug 2024
Takeaway for Sellers: Price growth is intact. Presentation and strategic pricing remain critical to catch early-fall buyers.
Takeaway for Buyers: Rising prices + slightly more balance means acting quickly on a well-priced, move-in-ready home still matters.
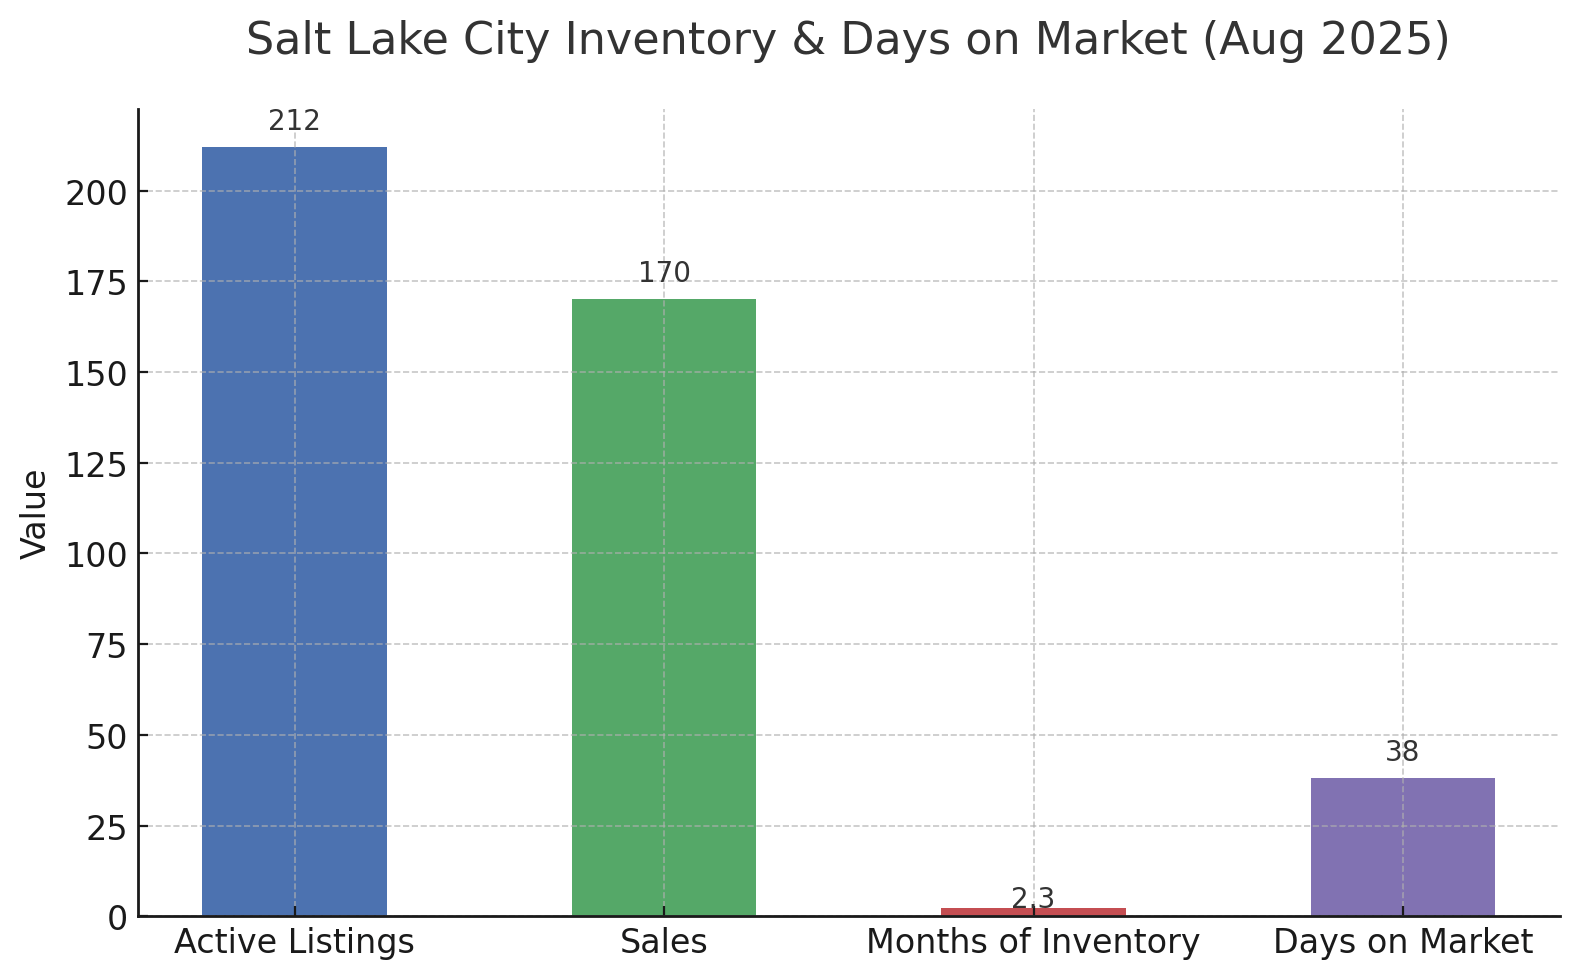
🏘️ Inventory & Days on Market
-
Active (SLC SFH, Aug 2025): 212
-
Sales (SLC SFH, Aug 2025): 170
-
Months of Inventory (SLC SFH): 2.3 (seller’s market)
-
Days on Market (SLC SFH): 38 (+2.7% YoY)
Buyer Tip: With just 2.3 months of inventory, the best homes won’t linger. Get pre-approved and be offer-ready.
Seller Tip: Homes with strong curb appeal and light interior updates are still selling faster than the average.
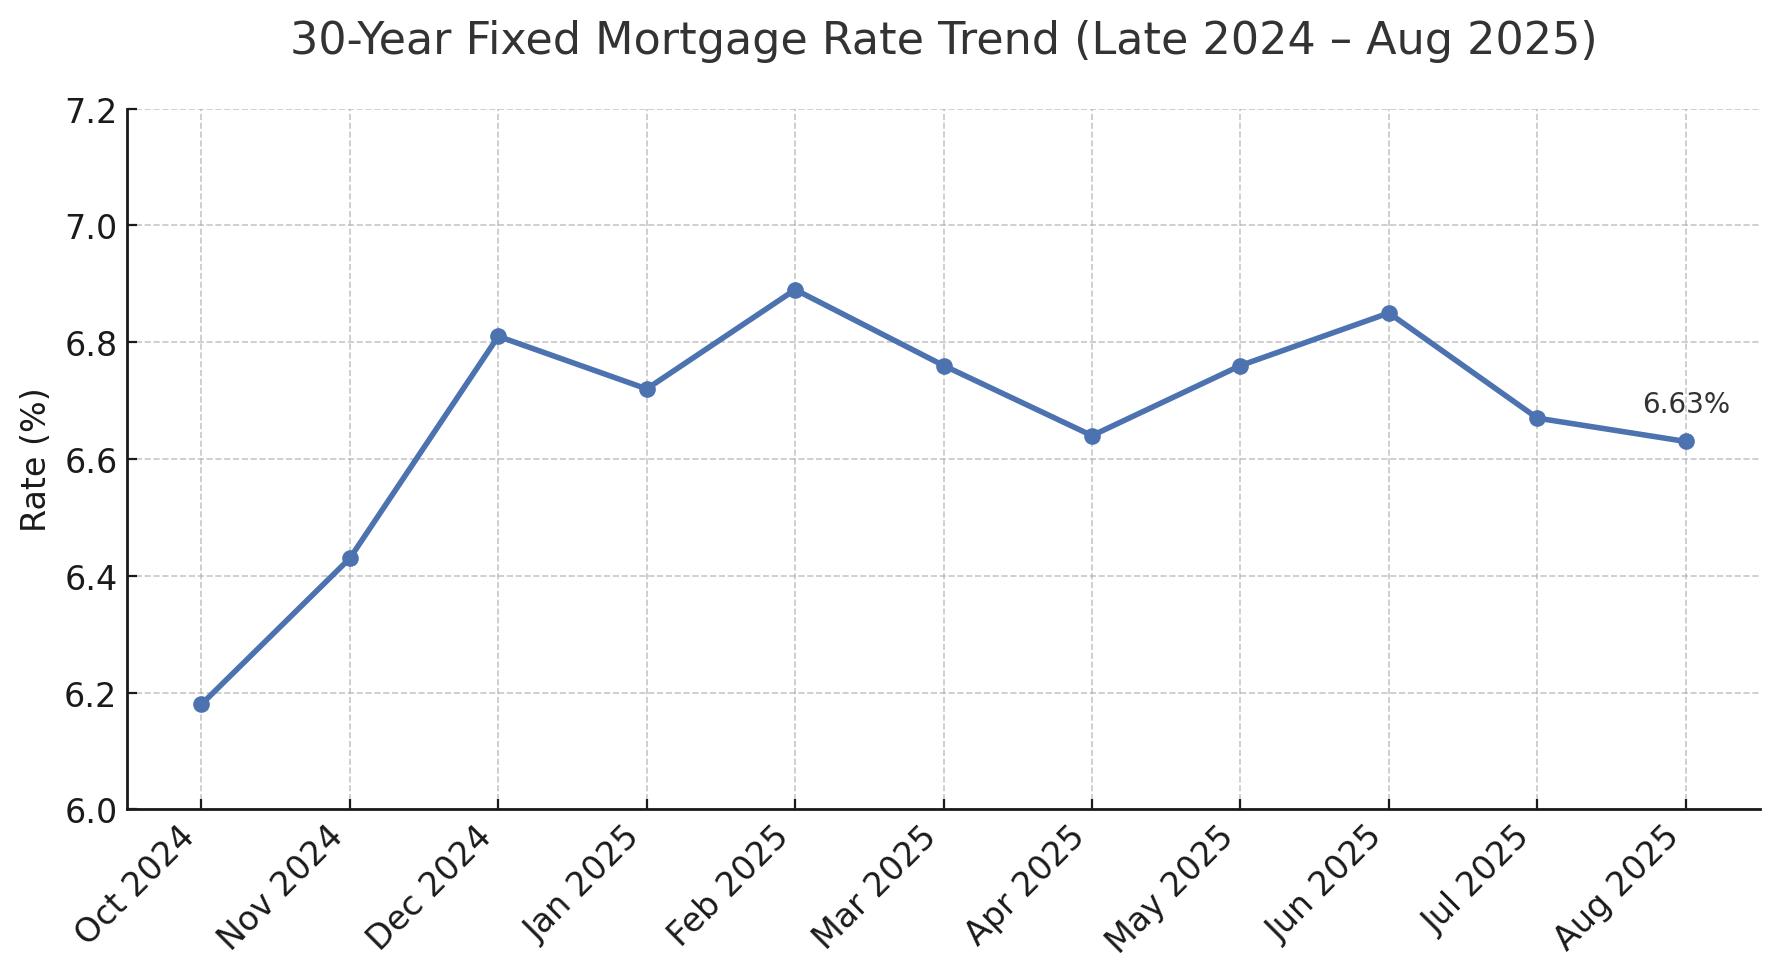
💵 Mortgage Rate Snapshot
-
30-Year Fixed (Freddie Mac, ~Aug 1, 2025): ~6.63%
-
Trend since late 2024: off peak highs, but not yet “low.”
What this means: If rates dip further, buyer competition could intensify. Buying now and refinancing later remains a viable strategy for many.
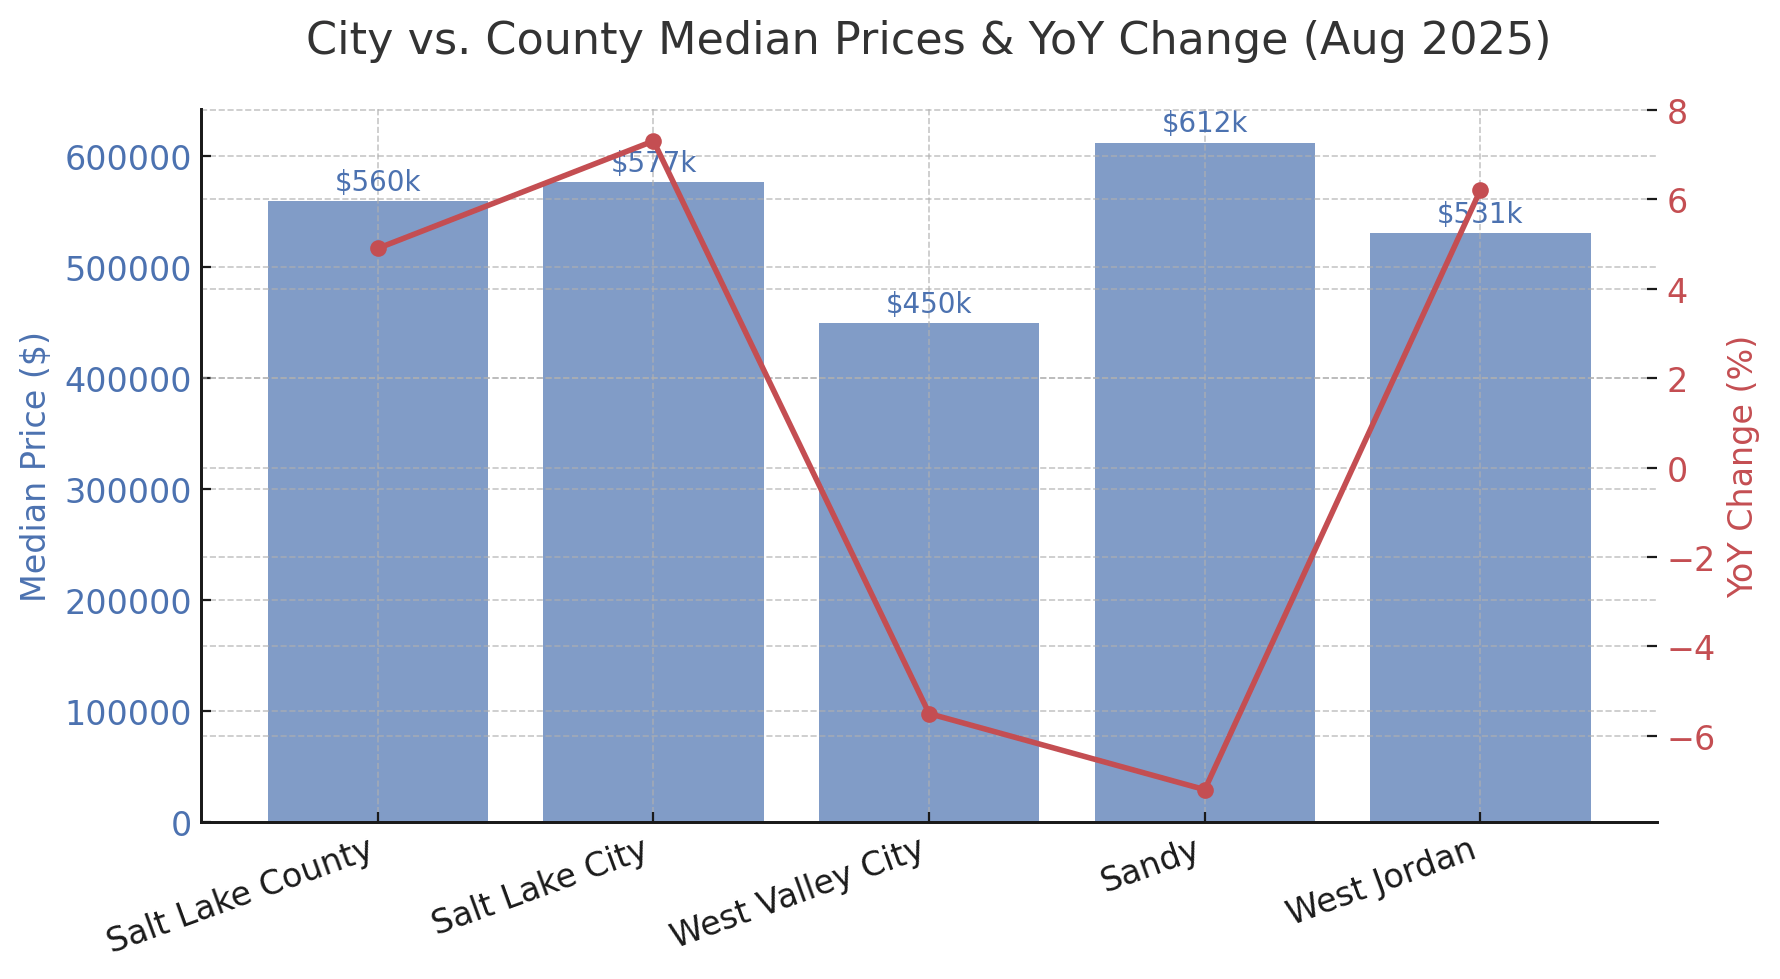
🌆 City vs. County: Helpful Context
Salt Lake County (all dwelling types, Aug 2025):
-
New Listings: 1,043 | Sold: 1,058
-
Months of Inventory: ~3.0 (seller’s market, moving toward balance)
-
Median Sales Price: $560,000 (+4.9% YoY)
-
Days on Market: 57 (+39.0% YoY)
City snapshots (Aug 2025 vs Aug 2024, all dwelling types):
-
Salt Lake City: $577,000 (+7.3%) | 219 sold (vs 256)
-
West Valley City: $450,000 (–5.5%) | 75 sold (vs 66)
-
Sandy: $612,500 (–7.2%) | 90 sold (vs 83)
-
West Jordan: $531,000 (+6.2%) | 97 sold (vs 108)
Quick read: Mixed pricing across the county; SLC proper and West Jordan are up YoY, while Sandy and West Valley are softer—classic “micro-market” behavior.
🔥 In-Demand Areas (Qualitative)
-
Sugar House: Perennially strong thanks to walkability and charming craftsman stock.
-
Holladay: Larger lots, mature trees, and established neighborhoods draw fall buyers.
-
Lehi & Saratoga Springs: Steady demand tied to tech-corridor jobs and new construction value.
-
East Bench: Views and trail access keep this on many buyers’ A-lists.
🔮 Looking Ahead: Q4 Forecast
-
Pricing: Likely to level seasonally through October–November.
-
Negotiation: Buyers may gain a bit more leverage on homes needing updates.
-
Supply: Fewer new listings could keep urgency elevated for turn-key properties.
-
Serious Fall Buyers: Those aiming to close before the holidays remain active.
Let’s Strategize Your Next Move
Whether you’re buying or selling, we’ll help you navigate SLC’s still-competitive—but gradually balancing—market with confidence.
📞 Book a call with Move Utah Real Estate to review comps, rates, and a step-by-step strategy tailored to your timeline and goals.